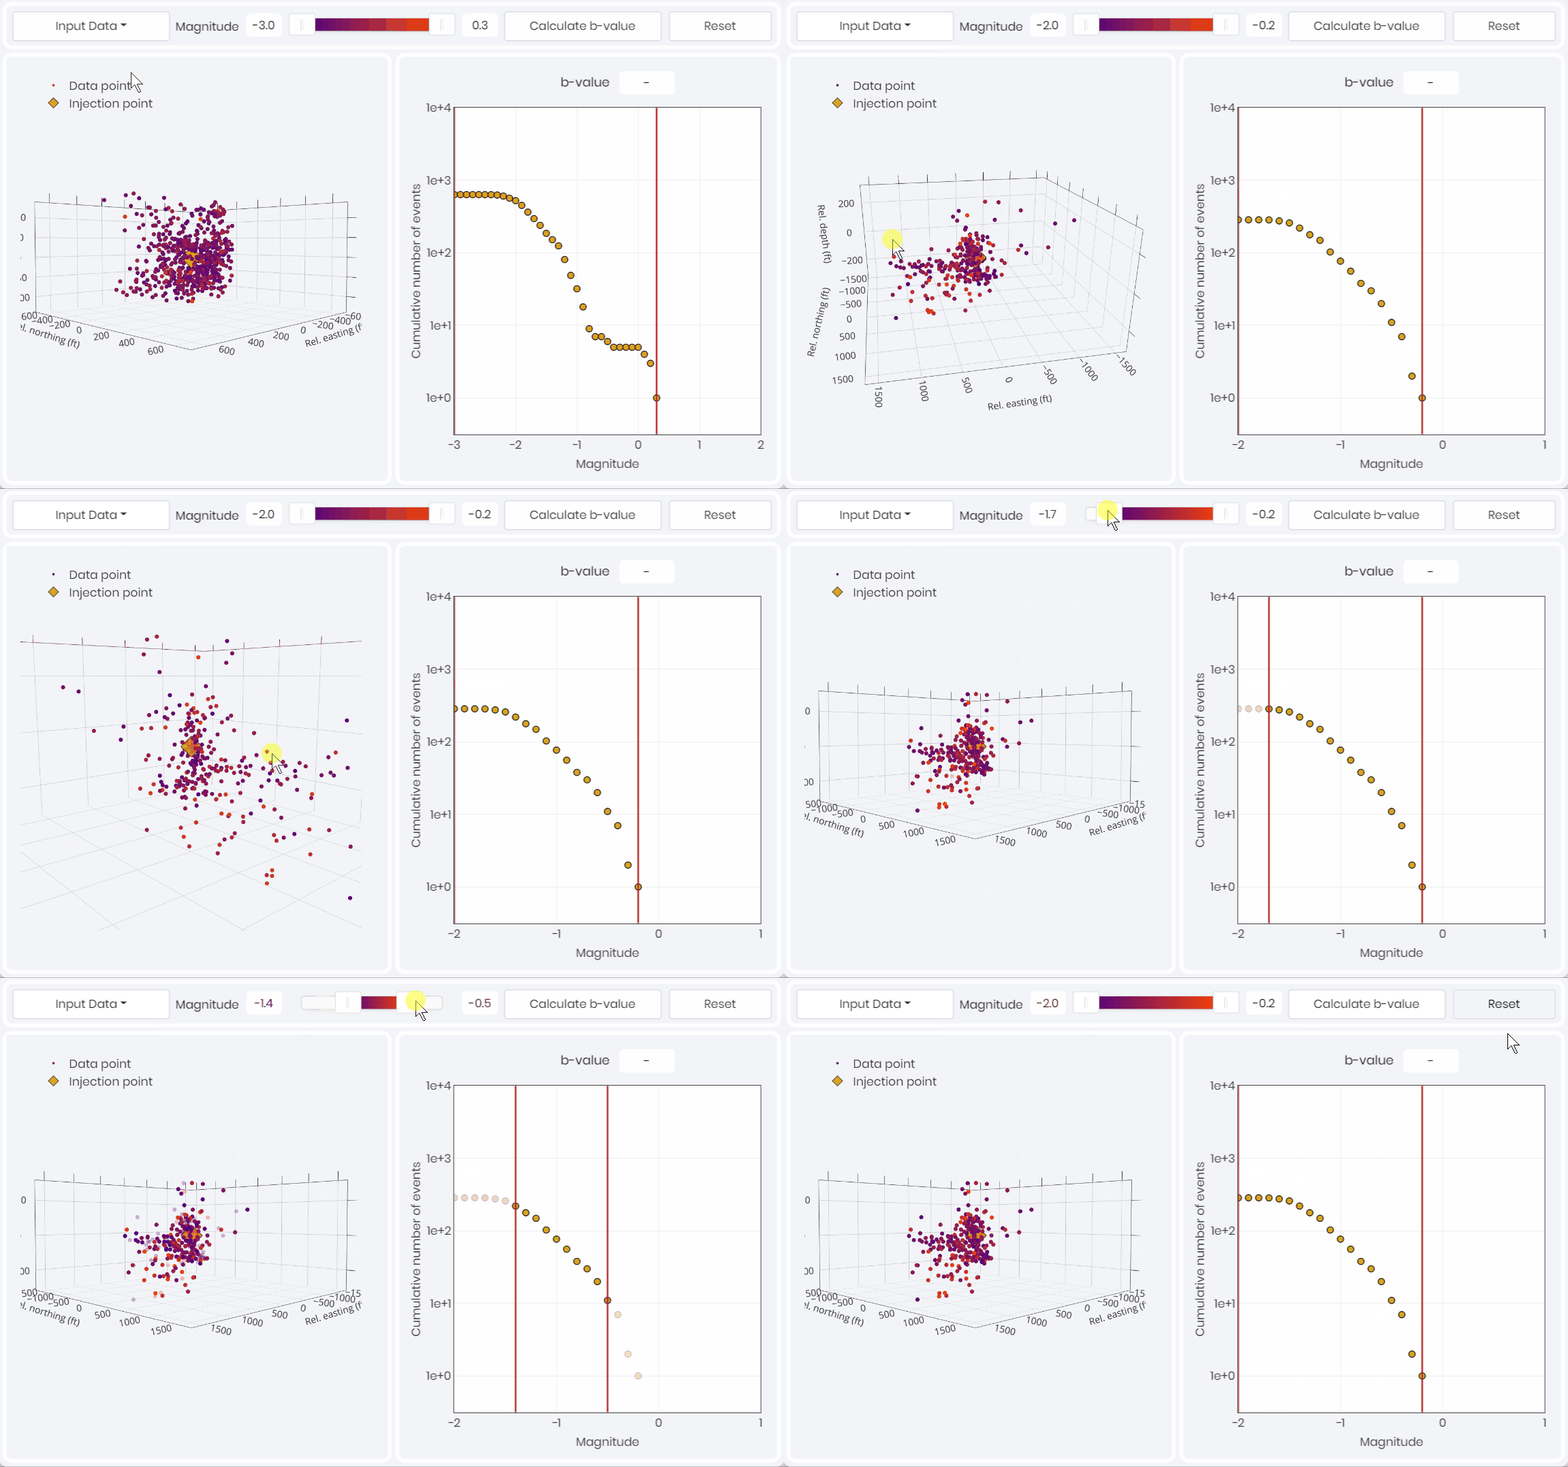
Simply put, b-value is the slope of a log-normal distribution of passive seismic event sizes, namely the number of events versus their magnitudes. It is often referred to as the Gutenburg-Richter relationship and used to describe the nature of earthquake distributions in both space and time. Initially it was believed that b-values could be used as a predictor of large magnitude event occurrences but more commonly it has been used to describe the stress and fracture state of a rock volume.
Used cases of b-value
- Hydraulic fracturing response
- Depending on fracture complexity the b-values can change. It is well known that for large scale earthquakes associated with faults the b-values tend towards 1 globally. If we follow Aki’s approach with D=2b, where D is the fractal dimension, a b-value of 1.5 would represent a complex interconnected network of fractures in three dimensions. This would suggest that volumes where b approaches 1.5 would be a good proxy for the stimulated reservoir volume that leads to production.
- Magnitude of completeness for passive seismic data
- The flattening of slope at lower magnitudes represent the incompleteness in recording over the volume of interest. Similarly, the lack of larger events, resulting in steeper slopes greater than 1.5, are either related to in-sufficient recording time, or to restrictions in event generation due to geologic elements.
Restricting the magnitude range of interest using a b-value plot allows for arriving at a robust and unbiased passive seismic dataset to describe reservoir behavior more accurately.
Ted Urbancic, Scientific Advisor

Above 👆 is the “Seismicity Distribution” simulation in the metaKinetic platform, to facilitate defining the magnitude of completeness for one stage of hydraulic fracturnig and interpreting the rock volume characteristics.
Want to have access to this simulation and investigate b-values? Contact us!
